Tinkering with OpenLayers and JS - Cajal - a hacked up neuroscience research map
- #Community, #Computational neuroscience, #Fedora, #Programming, #Python, #OpenLayers, #JavaScript, #Cajal
I was a bit fed up with the various minute issues my simulations kept throwing at me and decided I needed a distraction to keep me from completely burning out. Research is hard work, and sometimes we hit solid walls where no progress seems possible. I haven't hit one yet, but I was beginning to see that my performance had begun to drop. The simplest answer to this situation is to take a holiday - a change of scenery. Unfortunately, I haven't any plans to take one at the moment. I've never understood the appeal of wandering around crowded cities with throngs of tourists anyway. Instead, I decided to set my simulations aside for a few days and tinker with other things for a bit.
I decided to take up a short "passion project". It needed to be something that would keep me occupied for a few days at the most. I'd tinkered with OpenLayers before and I'd been meaning to brush up on my JavaScript recently seeing as how it's become quite a dominant scripting language. So I thought up a simple web application that would use the two to do something useful.
Cajal
To start with, the app needs to have a name. I've come up with some unique ones before (Zaphod, Calliope). This time I decided to pay homage to Santiago Ramón y Cajal who is considered the father of modern neuroscience. There are multiple applications called Cajal already, but not too many of them seem to be related to neuroscience. Unique enough, then.
Cajal is a simple web page that shows a world map. On this map are markers that denote different neuroscience laboratories. The markers are clickable, so when you click one of these, some information about the laboratory is displayed below the map - the principal investigator, the website address, and the sort. I've only managed to add a few laboratories to it now, but I've hosted a working demo here. The screenshot below shows what it looks like.
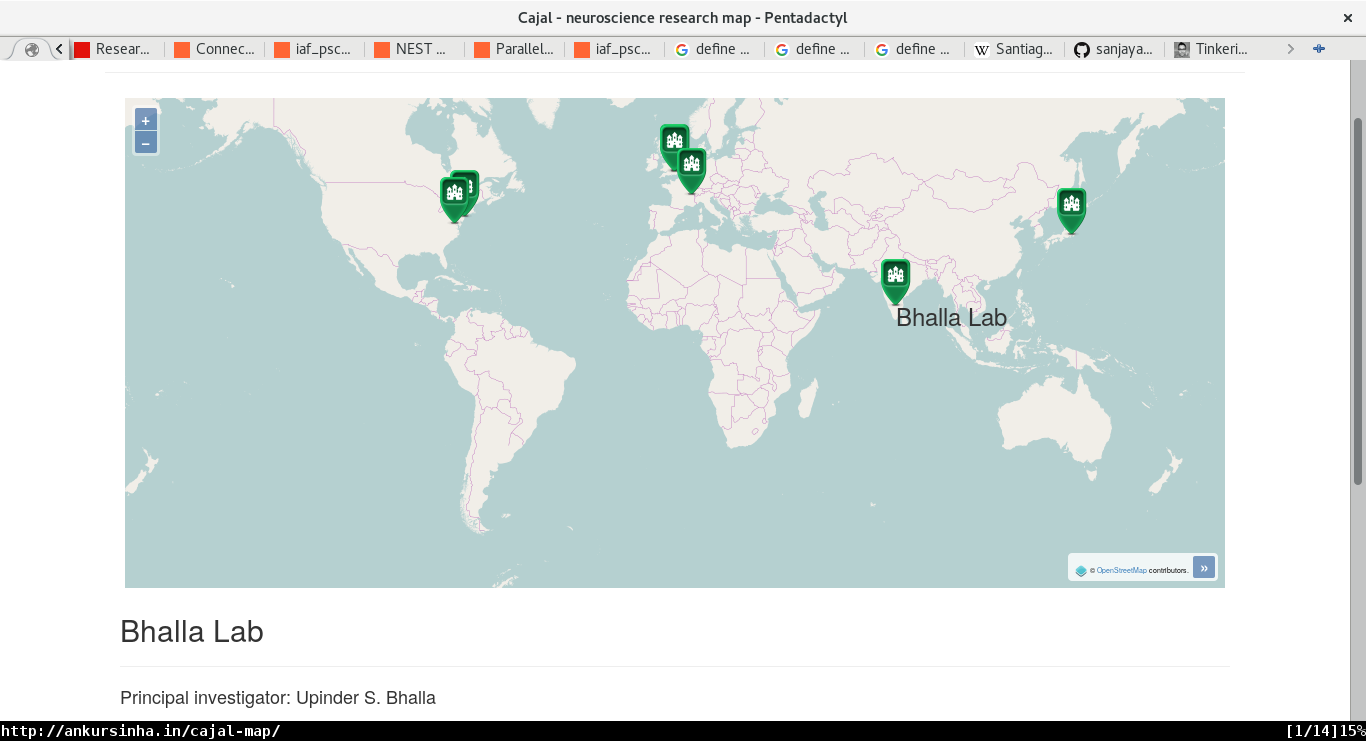
The code is quite simple. The data is stored in a yaml file at data/groups.yaml. The Python script bin/populate_map.py takes this file and generates a JavaScript file with functions to set up the map, overlay the markers, and assign them all singleclick events that display information - js/cajal.js. The main index.html file uses this JavaScript file to show a map and the markers with their associated information.
Maybe there is a better, less hacky, way of going about it, but this works for a quick two day project. In the future, maybe I can use a server side database and so on - it depends on how much it needs to scale. I know my shared hosting account can't handle all that!
The source code is available on Github. To add more laboratories, entries need to be added to the data/groups.yaml file - that's all. If you're a neuroscience researcher and want to add to the map, please open pull requests and I can then periodically regenerate the page as required.
Comments