Python - analysing large files - some notes to self
Use Pandas instead of Numpy to load your data
When most of us think of using Python for scientific computing, Numpy comes to mind. I've used it before. Recently, I ran into Pandas which is a library that's tailored for data analysis. Usually, you'd use Numpy to load data, but it was extremely slow with my large data (30 Gb) files. When I looked around a bit, I found this post which explained it - so, do not use numpy.loadtxt(), instead use pandas.load_csv(). An alternative would be to to use memory mapped files as I'd done before with C++ - Numpy does support them.
Use Matplotlib for easy stuff but Gnuplot when you need performance
I usually use Gnuplot to plot my graphs. As this answer on stackoverflow shows, Gnuplot performs much better than Matplotlib. The common complain seems to be that the figures from Gnuplot don't look modern enough. This, however, is only so if you use the default Gnuplot settings. There are multiple posts on the internet that explain how to improve Gnuplot figures by changing the default settings. Both Gnuplot and Matplotlib are tools and they fit specific purposes. I'm now using Gnuplot for large data sets (multiple Gbs) and Matplotlib for smaller ones (a few Mbs).
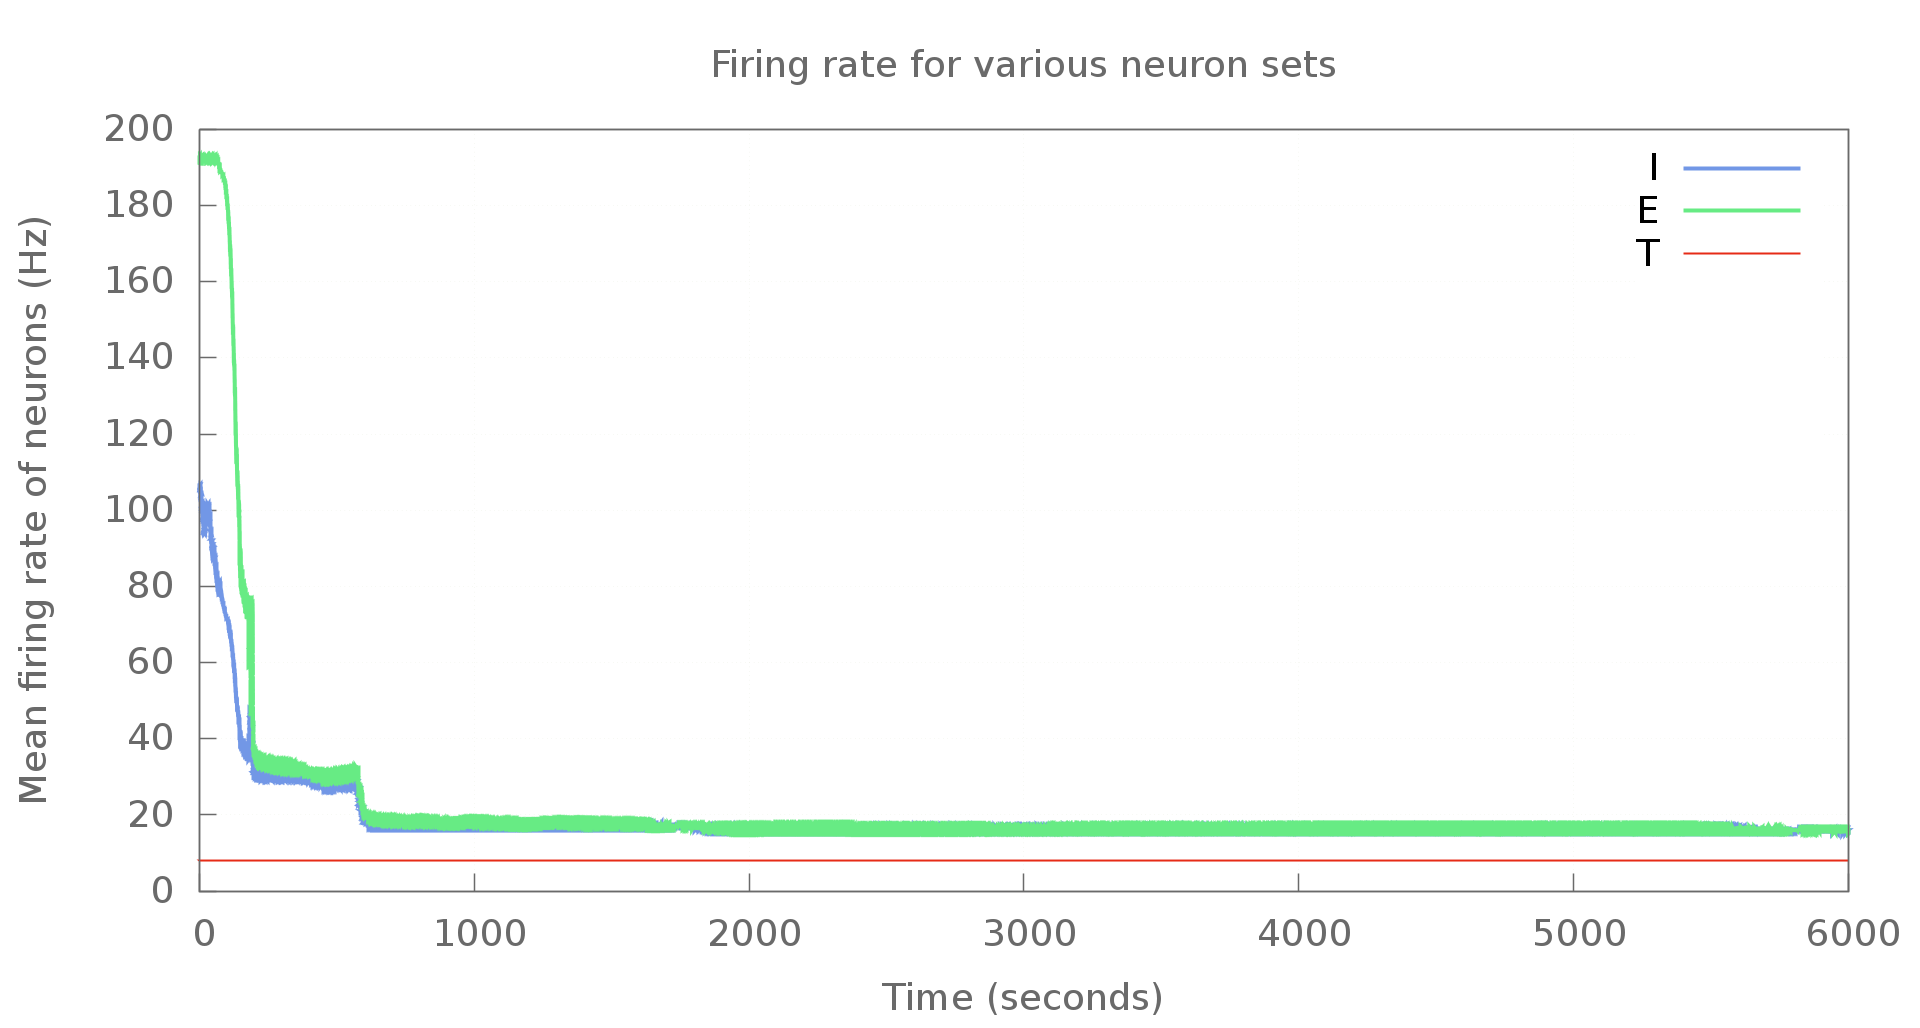
An example graph generated using Gnuplot is shown below. This is with modified settings, of course. Doesn't look too bad, does it?
If you're looking to use Gnuplot with Python, there's a Gnuplot.py package that makes it much easier. Unfortunately, though, the package does not work with Python3. Upstream seems to be inactive - my e-mail to the mailing list hasn't received any replies. I've put the code here on Github at the moment. When I do have free cycles, I'll look at porting it over to Python3. Pull requests are welcome, of course.
There's even a library that lets you use Gnuplot with C++ here.
Use chunks when loading data in Pandas
Pandas lets you load files in chunks and process these chunks individually. This way, even if you have extremely large files, you won't run end up using all your RAM.
Here's an example below. This takes a spike file which is a file with two columns: (neuron_IDs TAB spike_times) and counts the spikes in each second to print them to a new file that I pass to Gnuplot.
Note that since I need a sliding window to count my spikes, I keep the required bits of the previous chunk around.
#!/usr/bin/env python3
"""
Take a nest gdf file with spike times and calculate mean population firing rates.

File: spike2hz.py

Copyright 2016 Ankur Sinha
Author: Ankur Sinha <sanjay DOT ankur AT gmail DOT com>

This program is free software: you can redistribute it and/or modify
it under the terms of the GNU General Public License as published by
the Free Software Foundation, either version 3 of the License, or
(at your option) any later version.

This program is distributed in the hope that it will be useful,
but WITHOUT ANY WARRANTY; without even the implied warranty of
MERCHANTABILITY or FITNESS FOR A PARTICULAR PURPOSE.  See the
GNU General Public License for more details.

You should have received a copy of the GNU General Public License
along with this program.  If not, see <http://www.gnu.org/licenses/>.
"""

import numpy
import sys
import math
import pandas
import os.path
import gc


class spike2hz:

    """Main class for utlity.

    Nest gdf file format:

        <neuron gid>    <spike_time>

    Takes an entire spike file and generates the mean population firing
    rate file to be used for time graphs.
    """

    def __init__(self):
        """Main init method."""
        self.input_filename = ""
        self.output_filename = ""

        # Initial indices
        self.left = 0.
        self.right = 0.
        self.dt = 1.  # ms
        self.num_neurons = 8000.
        self.rows = 100000000.

    def setup(self, input_filename, output_filename, num_neurons=8000.,
              rows=100000000.):
        """Setup various things."""
        self.input_filename = input_filename
        self.output_filename = output_filename
        self.rows = rows
        self.output_file = open(self.output_filename, 'w')
        self.num_neurons = int(num_neurons)

        if not (
            os.path.exists(self.input_filename) and
            os.stat(self.input_filename).st_size > 0
        ):
            print("File not found. Skipping.", file=sys.stderr)
            return False

        return True

    def __validate_input(self, dataframe):
        """Check to see the input file is a two column file."""
        if dataframe.shape[1] != 2:
            print("Data seems incorrect - should have 2 columns. " +
                  "Please check and re-run", file=sys.stderr)
            return False
        else:
            print("Read " + str(dataframe.shape[0]) +
                  " rows.")
            return True

    def run(self):
        """Do the work."""
        start_row = 0
        current_time = 1000.
        old_spikes = numpy.array([])
        old_times = numpy.array([])
        for chunk in pandas.read_csv(self.input_filename, sep='\s+',
                                     names=["neuronID", "spike_time"],
                                     dtype={'neuronID': numpy.uint16,
                                            'spike_time': float},
                                     lineterminator="\n",
                                     skipinitialspace=True,
                                     header=None, index_col=None,
                                     chunksize=self.rows):

            if not self.__validate_input(chunk):
                print("Error in file. Skipping.", file=sys.stderr)
                return False

            spikes = numpy.array(chunk.values[:, 0])
            times = numpy.array(chunk.values[:, 1])

            # Keep some part of the previous chunk - because I subtract
            # 1000ms from the current time to count the number of spikes.
            if len(old_spikes) > 0:
                spikes = numpy.append(old_spikes, spikes)
                times = numpy.append(old_times, times)

            print(
                "Times from {} to {} being analysed containing {} rows".format(
                    times[0], times[-1], len(times)))
            print("Current time is {}".format(current_time))

            # Reset chunks
            self.left = 0
            self.right = 0

            while (current_time < math.floor(times[-1])):
                self.left += numpy.searchsorted(times[self.left:],
                                                (current_time - 1000.),
                                                side='left')
                self.right = self.left + numpy.searchsorted(
                    times[self.left:], current_time,
                    side='right')

                statement = ("{}\t{}\n".format(
                    current_time/1000.,
                    (
                        len(
                            spikes[self.left:self.right]
                        )/self.num_neurons)))

                self.output_file.write(statement)
                self.output_file.flush()

                current_time += self.dt

            print("Printed till {}".format(current_time))
            old_times = numpy.array(times[(self.left - len(times)):])
            old_spikes = numpy.array(spikes[(self.left - len(spikes)):])

            del spikes
            del times
            gc.collect()

        self.output_file.close()
Miscellaneous tips
- Changing font size in Matplotlib.
- Do not use numpy datatypes for arithmetic operations - it is 10x slower than Python built-ins. I learned of this the hard way - my processing times went up from a few hours to more than a day and I kept wondering why!
- Generating images without a window in Matplotlib - useful when you're using a headless system for your analysis.
Comments